Process and Performance Diagrams

A collection of process, milestone, strategy and KPI layouts for explaining workflows, comparing results and communicating improvement plans.

21 slides · Strategy

Every slide in this template

  1. Process and Performance Diagrams PowerPoint template with 21 editable white and lime slides for process and performance diagrams by Presentify
  2. Six process diagram slides covering process roadmap cover, growth process introduction and three-metric process snapshot
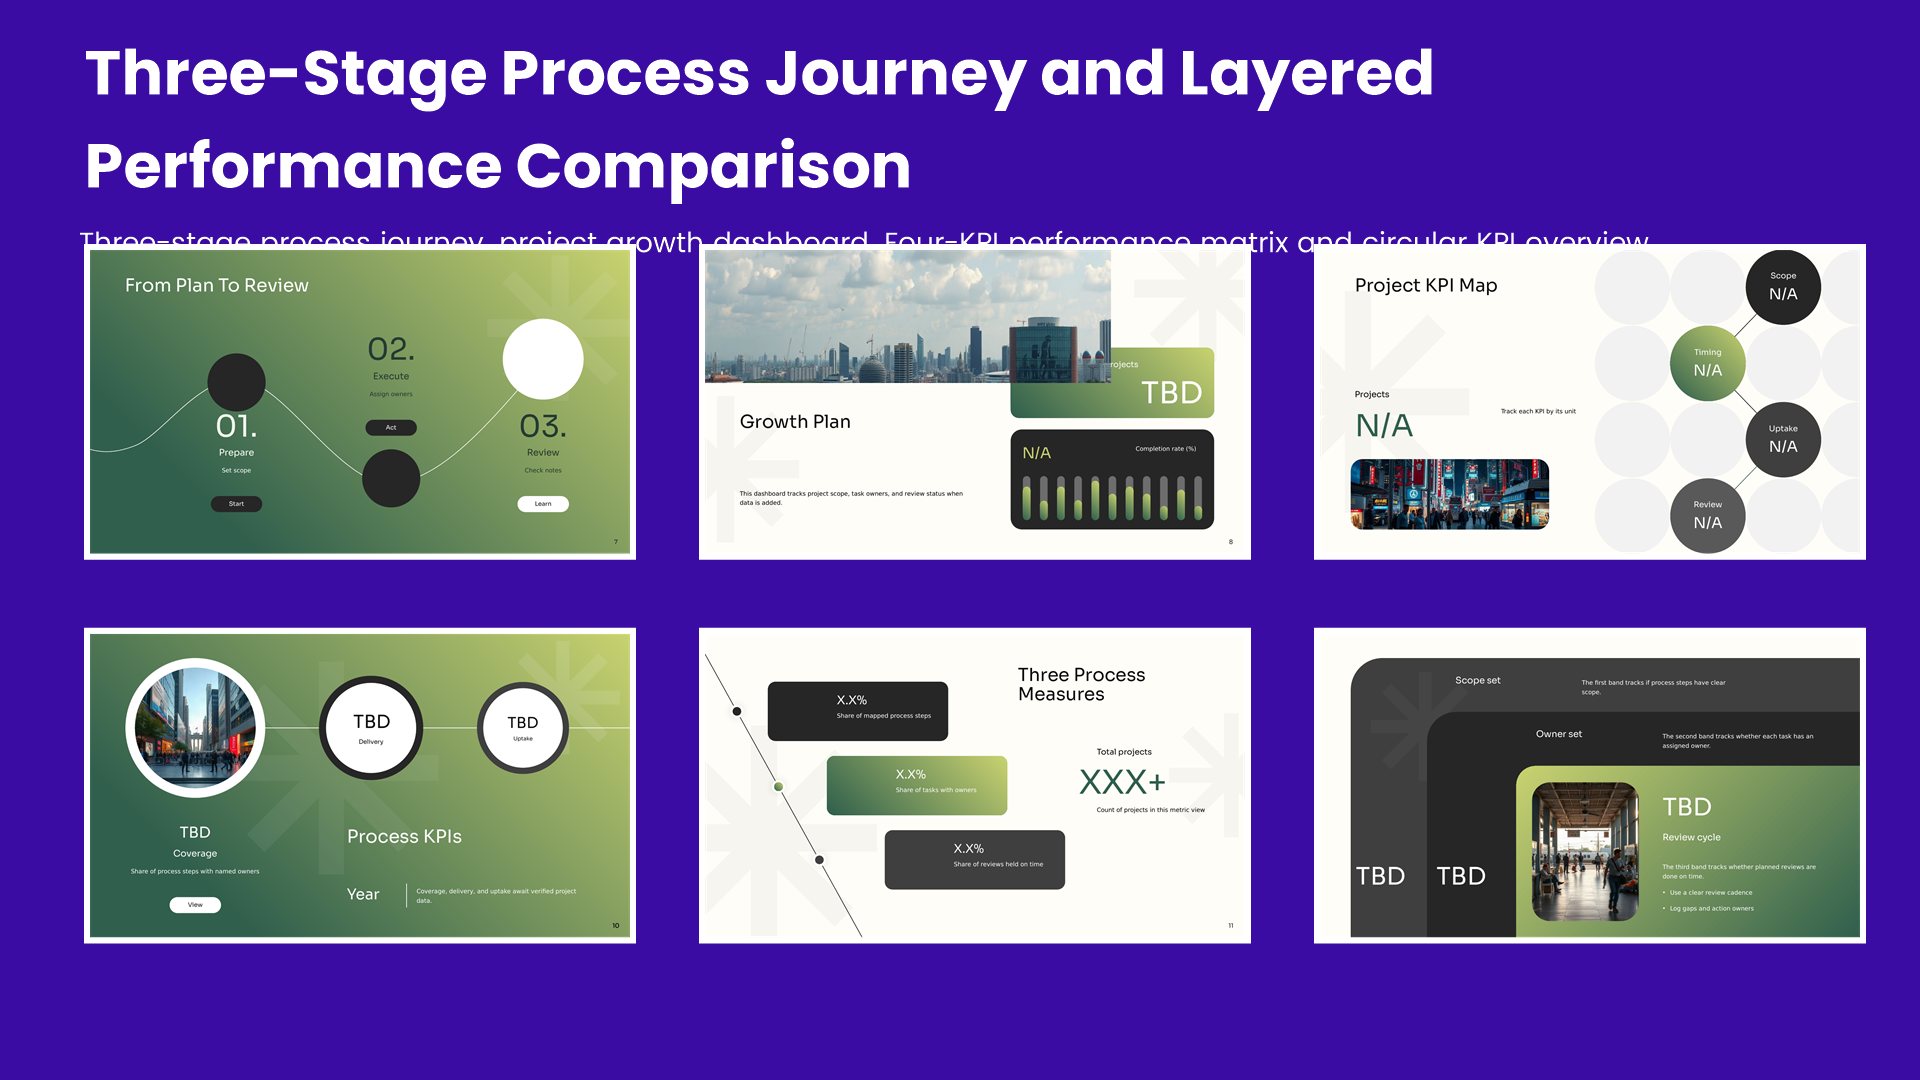
  3. Six process diagram slides covering three-stage process journey, project growth dashboard, Four-KPI performance matrix and circular KPI overview
  4. Six process diagram slides covering three-track progress chart, two-strategy improvement plan, value metrics cluster and operational KPI ladder
  5. Process Roadmap Cover
  6. Growth Process Introduction
  7. Three-Metric Process Snapshot
  8. Five-Category Performance Comparison
  9. Six-Step Circular Process
  10. Three-Milestone Performance Story
  11. Three-Stage Process Journey
  12. Project Growth Dashboard
  13. Four-KPI Performance Matrix
  14. Circular KPI Overview
  15. Diagonal Metric Progression
  16. Layered Performance Comparison
  17. Three-Track Progress Chart
  18. Two-Strategy Improvement Plan
  19. Value Metrics Cluster
  20. Operational KPI Ladder
  21. Ascending Process Milestones
  22. Two-Milestone Outcome Path
  23. Five-Stage KPI Timeline
  24. Four-Step Metric Journey
  25. Two-Action Strategy Summary