Performance Dashboard Visuals

A collection of dashboard layouts for presenting performance metrics, trends, comparisons, and progress updates across a topic or organization.

10 slides · Reviews & reports

Every slide in this template

  1. Performance Dashboard Visuals PowerPoint template with 10 editable white and blue slides for performance dashboard visuals by Presentify
  2. Six dashboard slides covering milestone metrics and trend lines, three KPI cards, project metrics and weekly performance and yearly trends
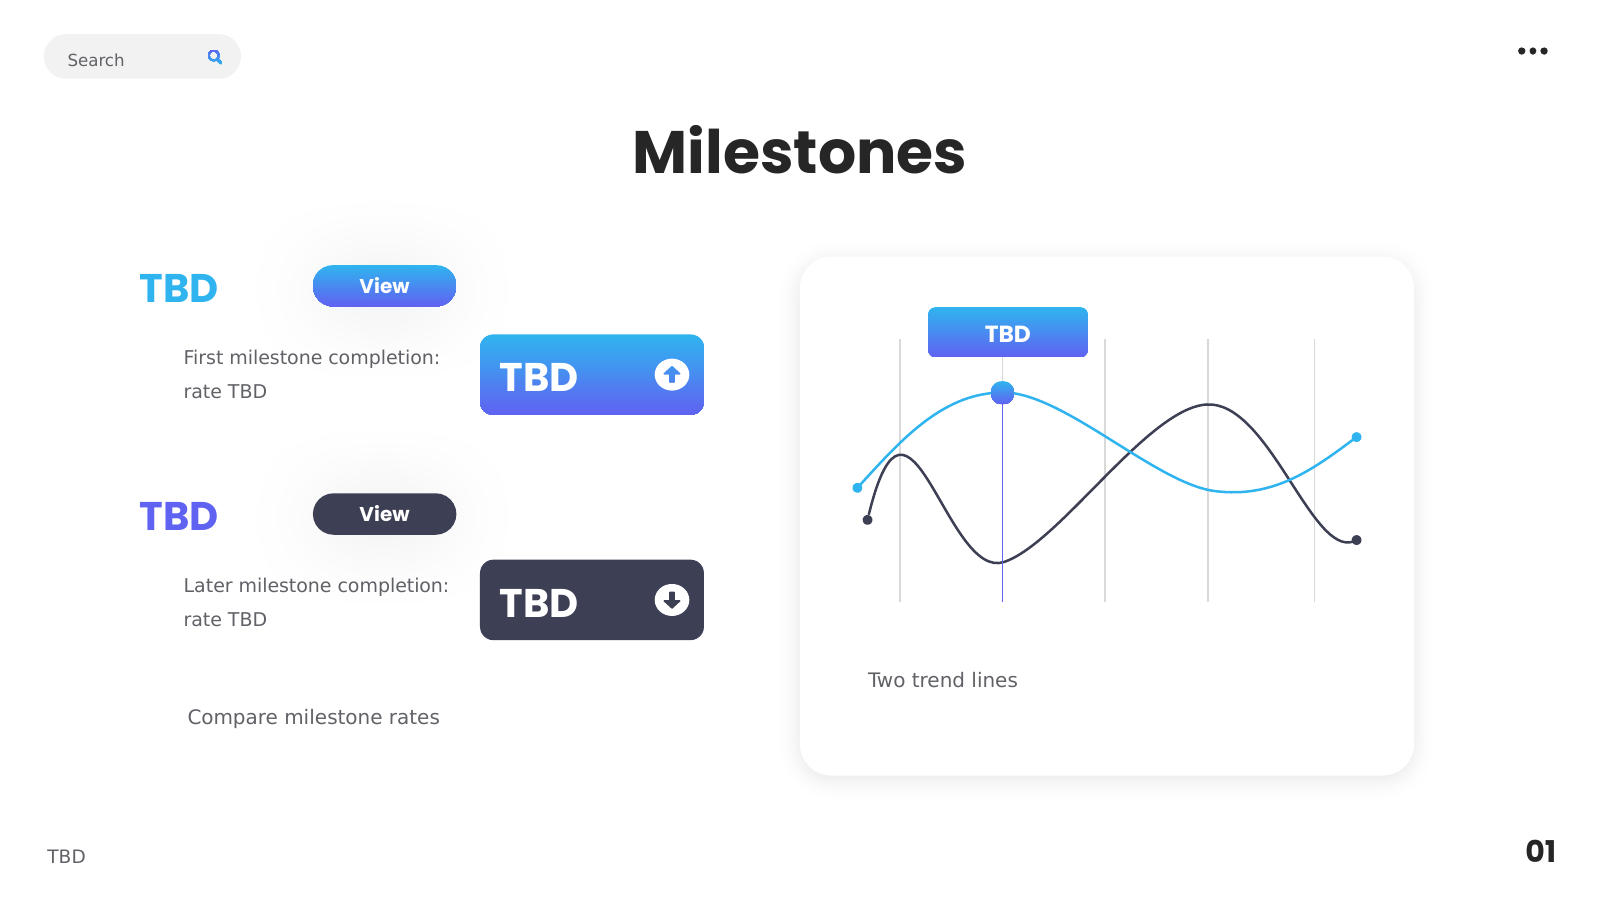
  3. Milestone Metrics and Trend Lines
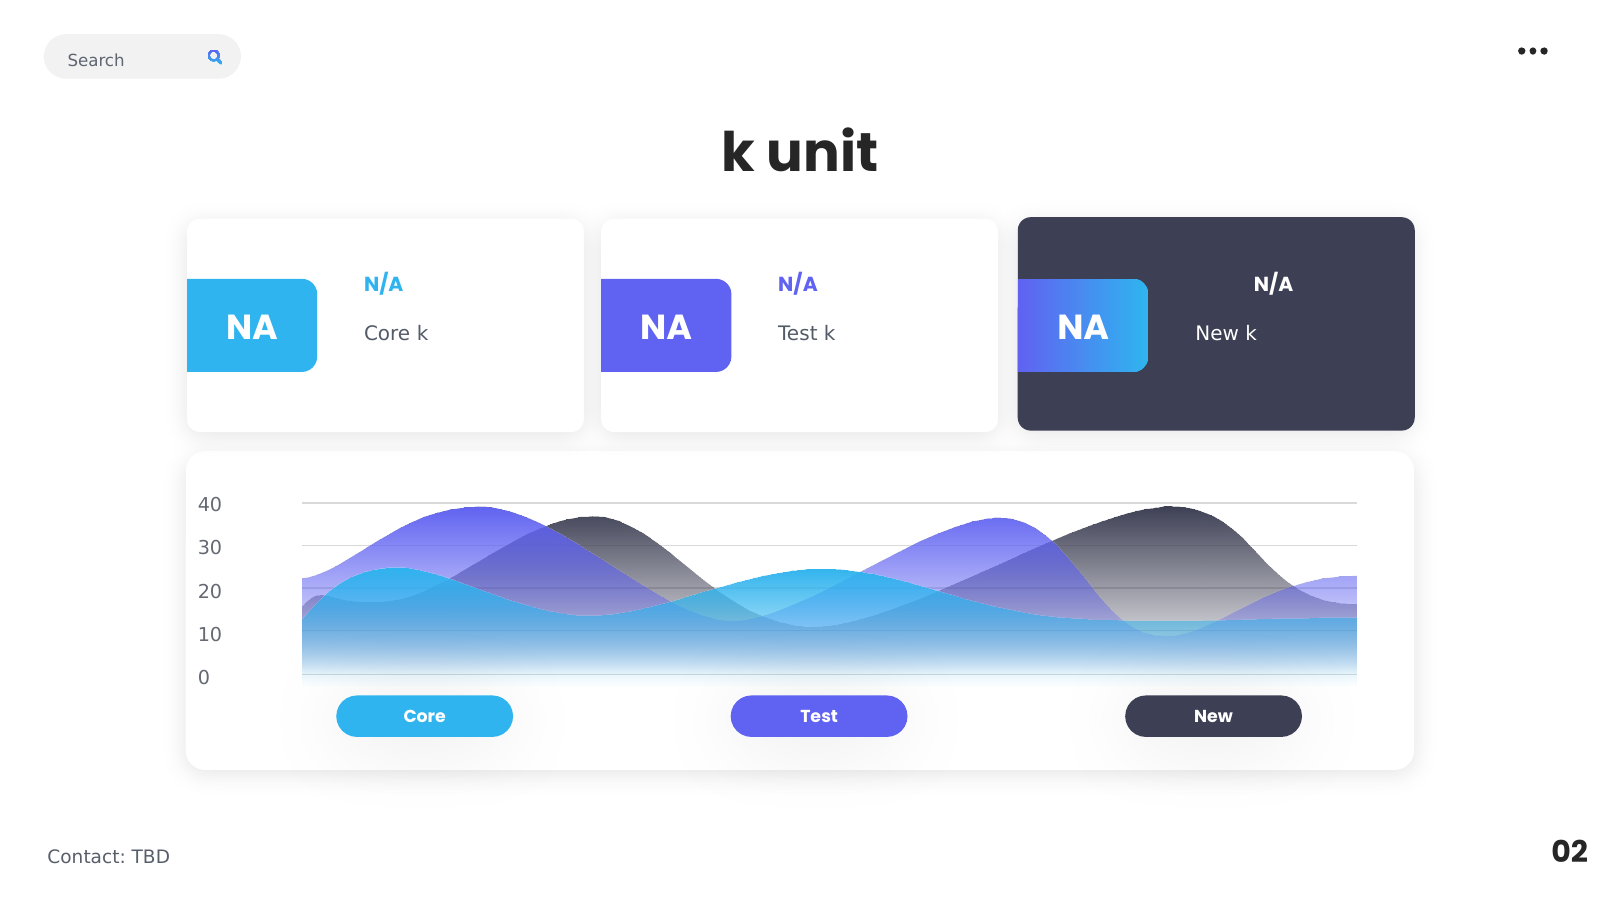
  4. Three KPI Cards with Area Comparison
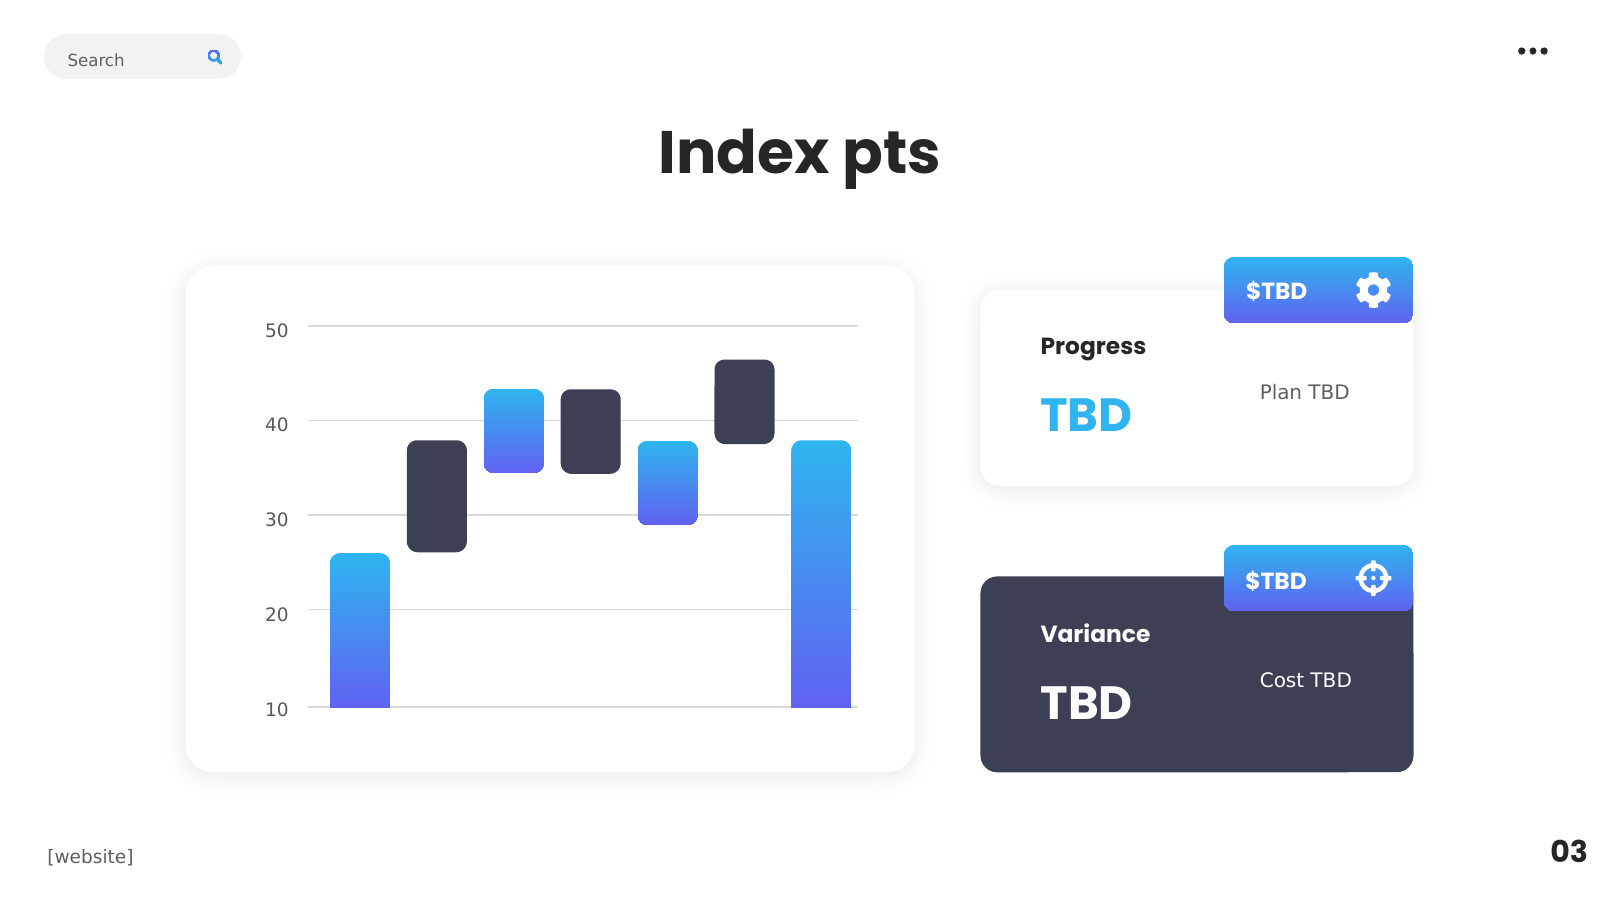
  5. Project Metrics with Column Chart
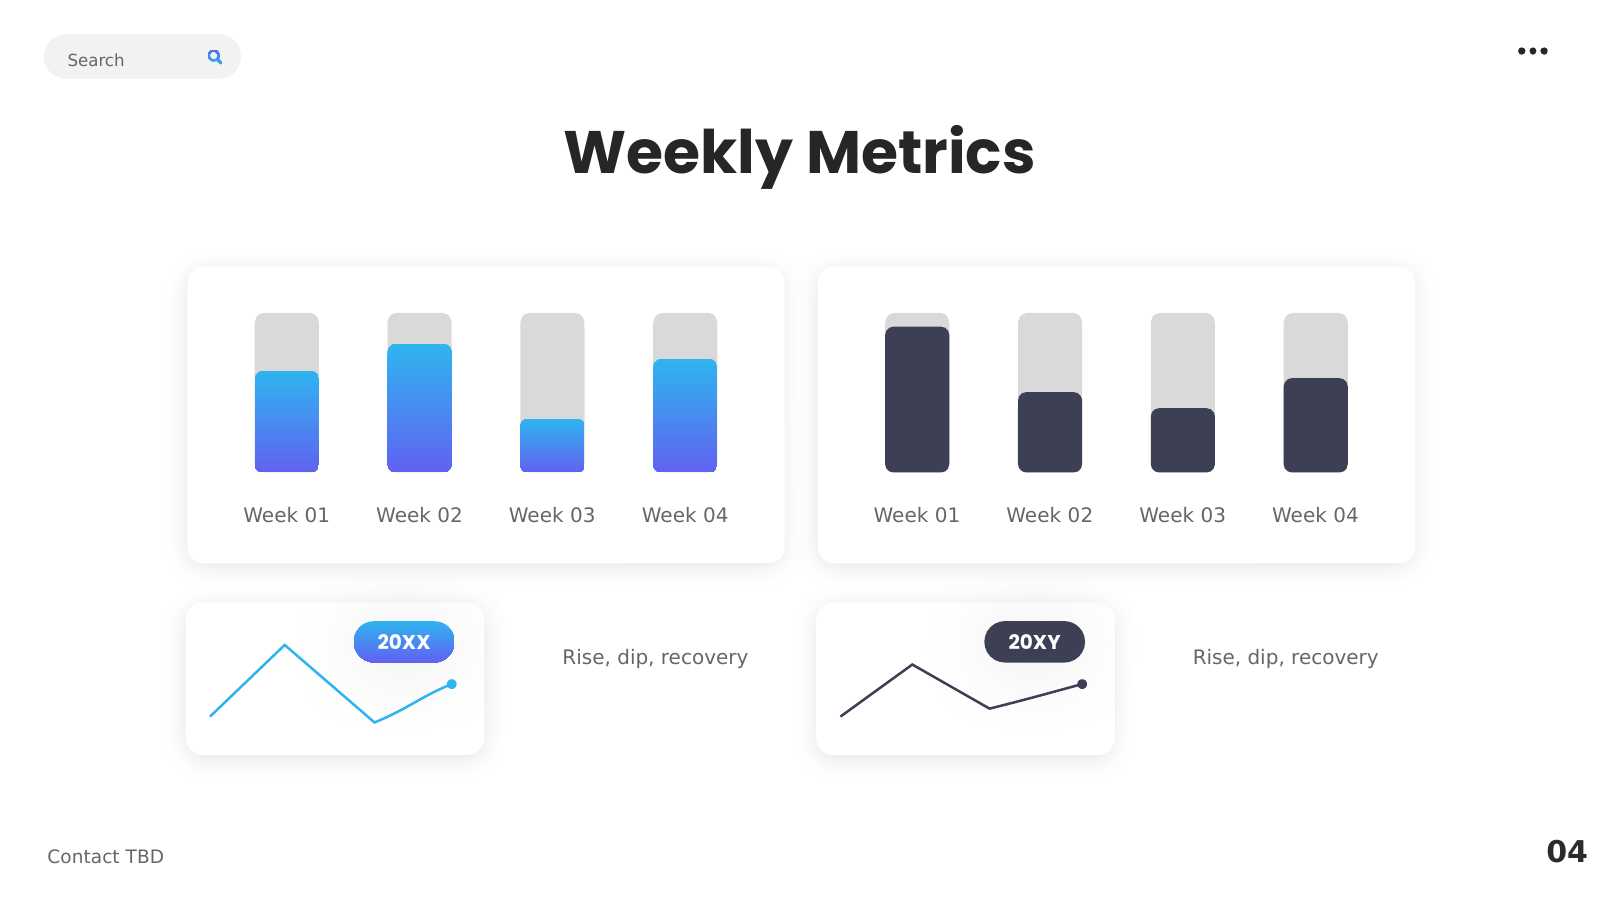
  6. Weekly Performance and Yearly Trends
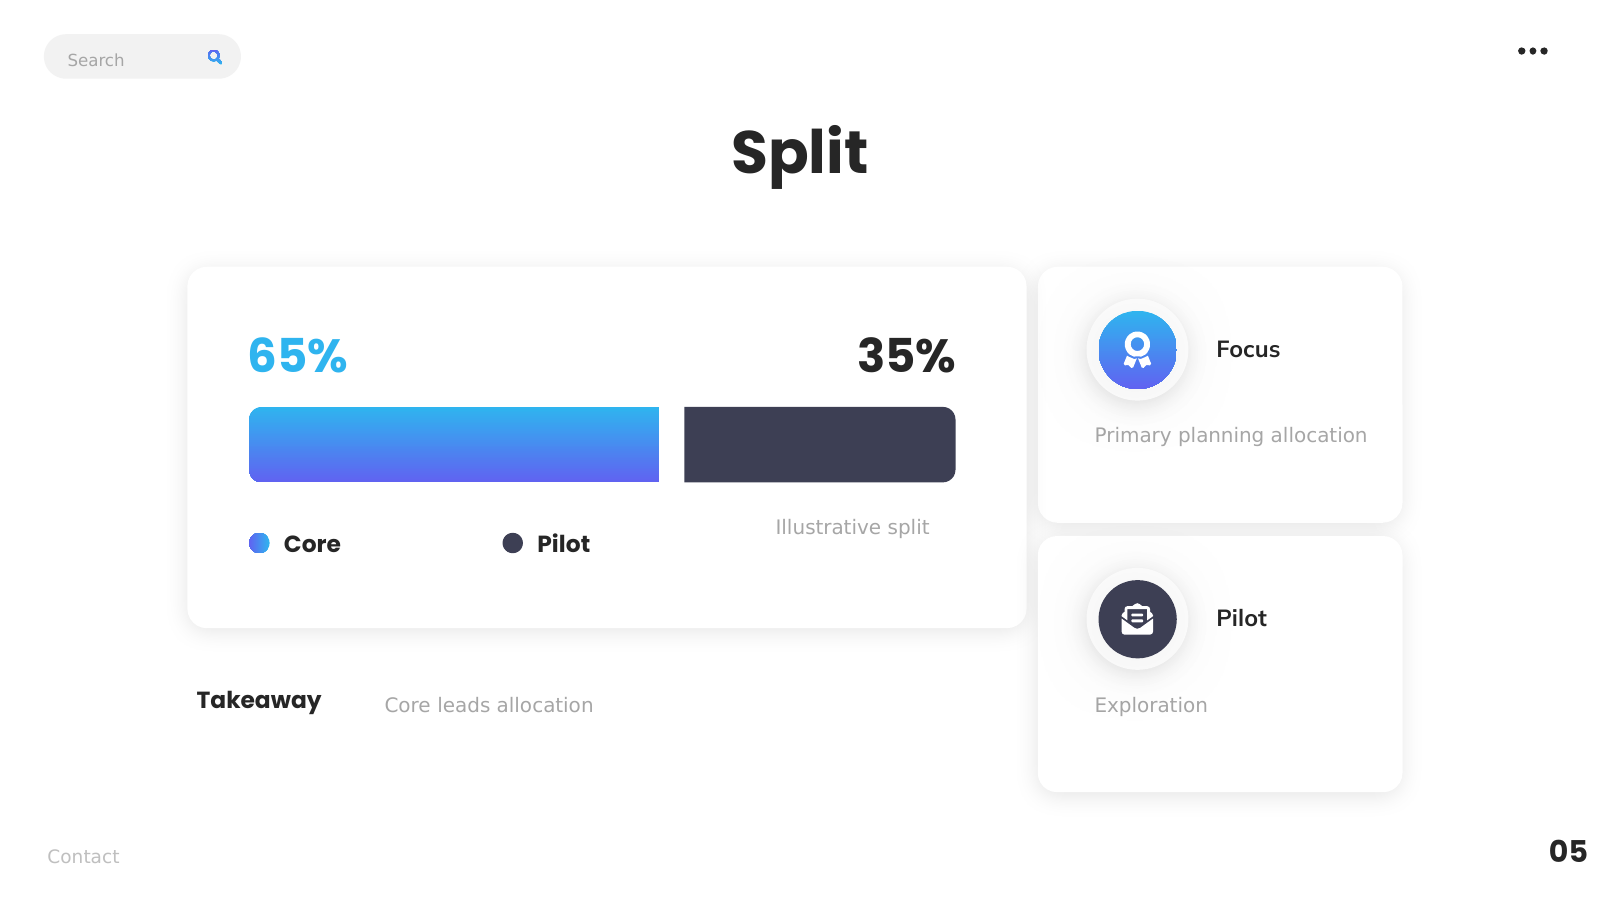
  7. Segment Split and Key Insights
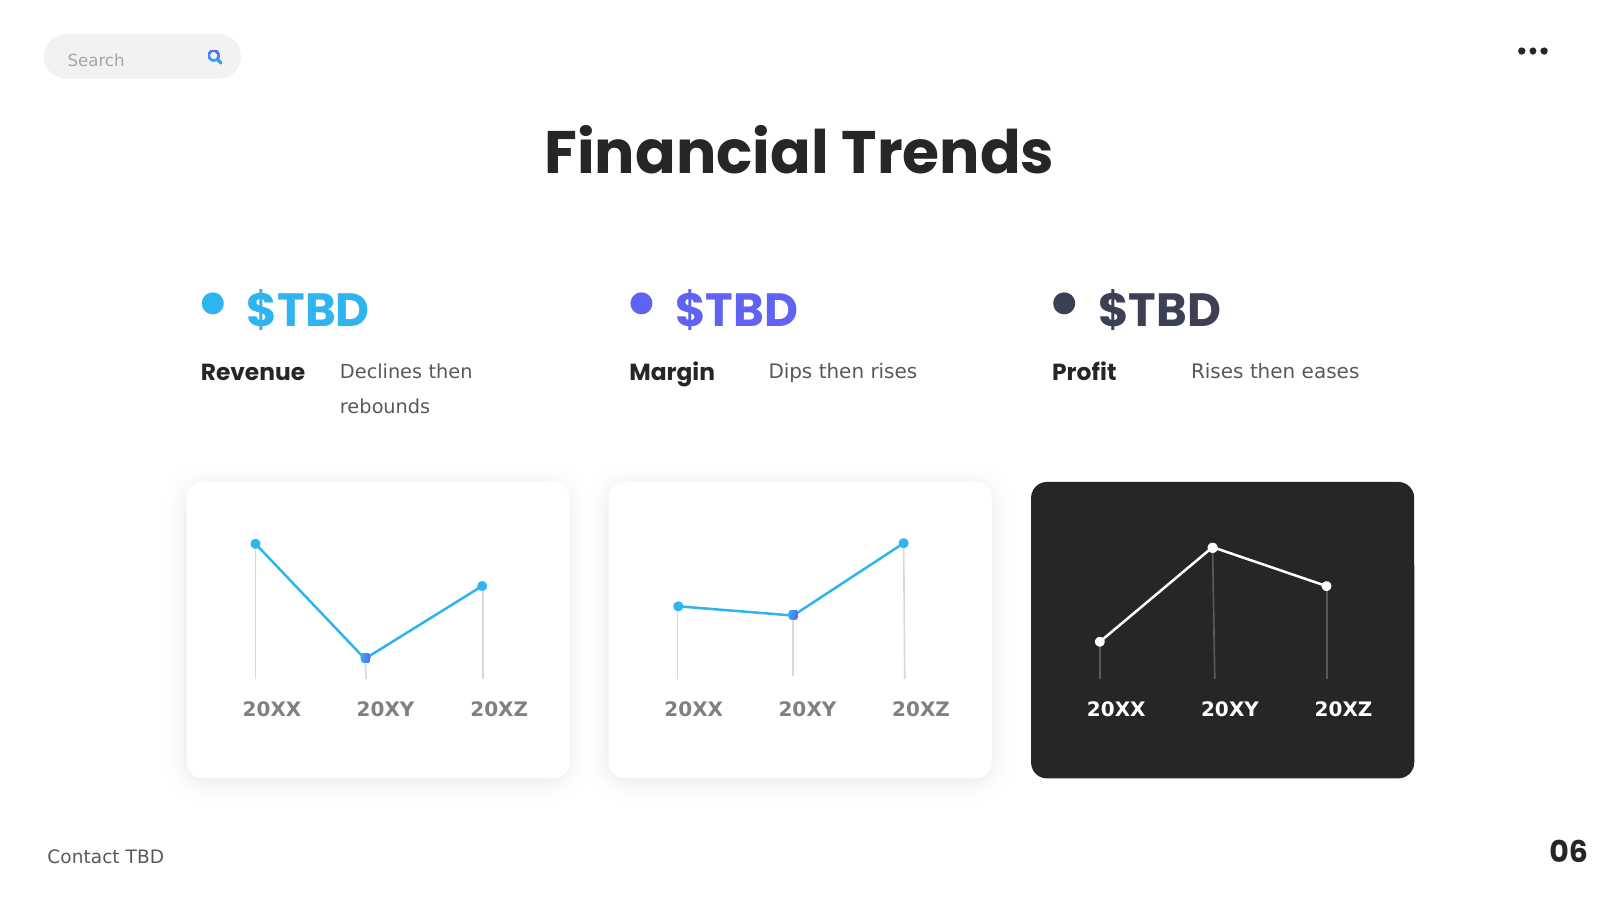
  8. Three-Period Financial Trends
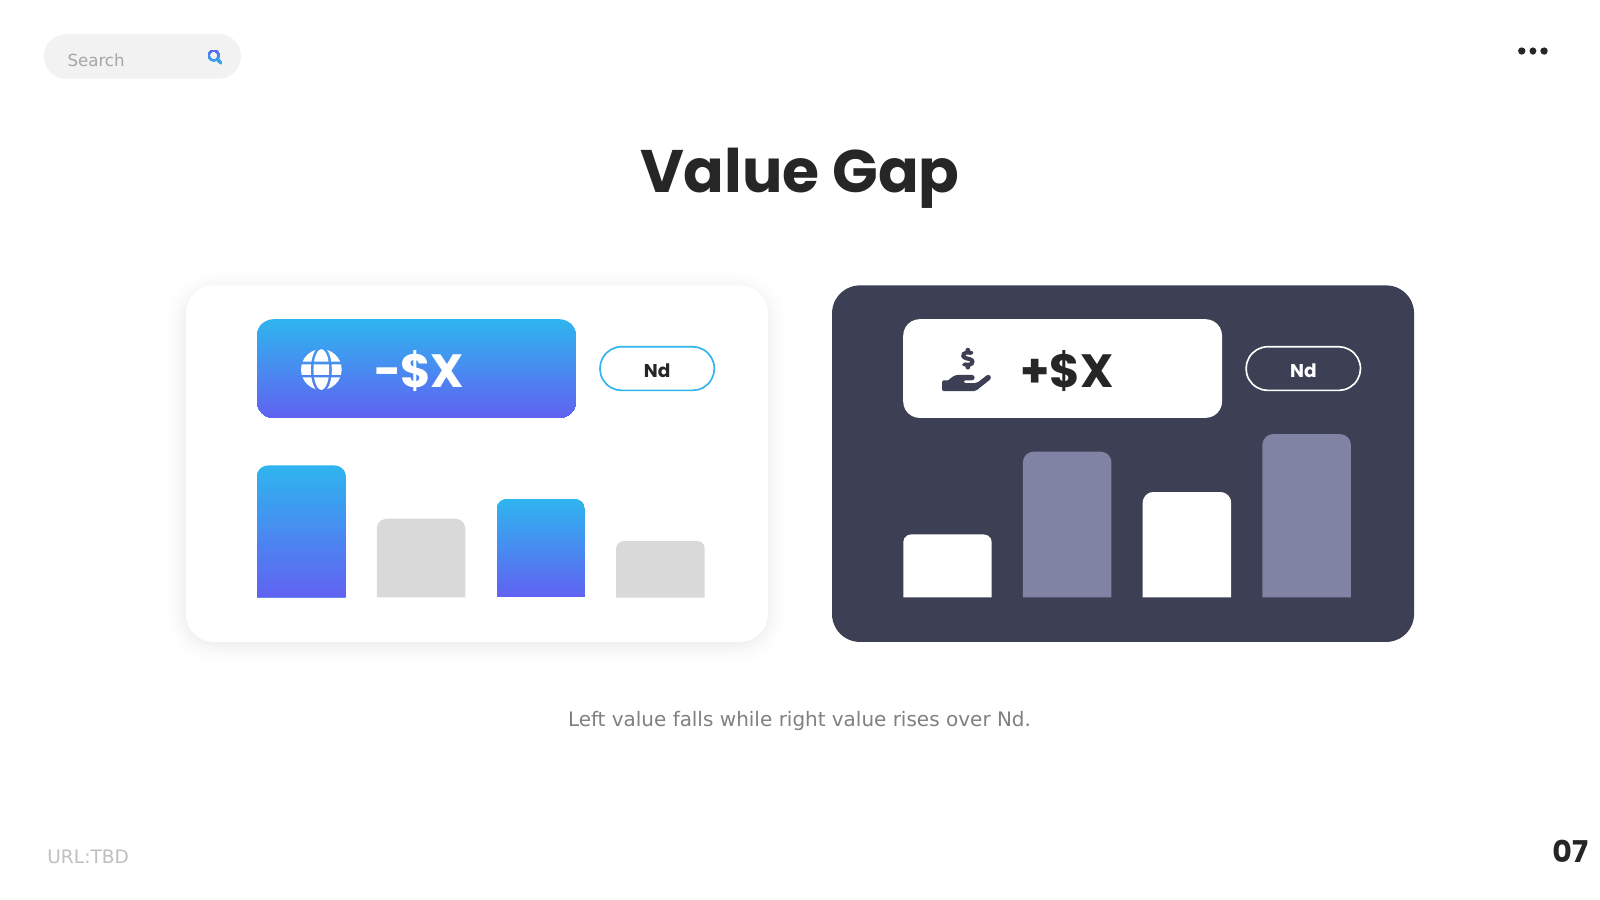
  9. Two-Scenario Value Comparison
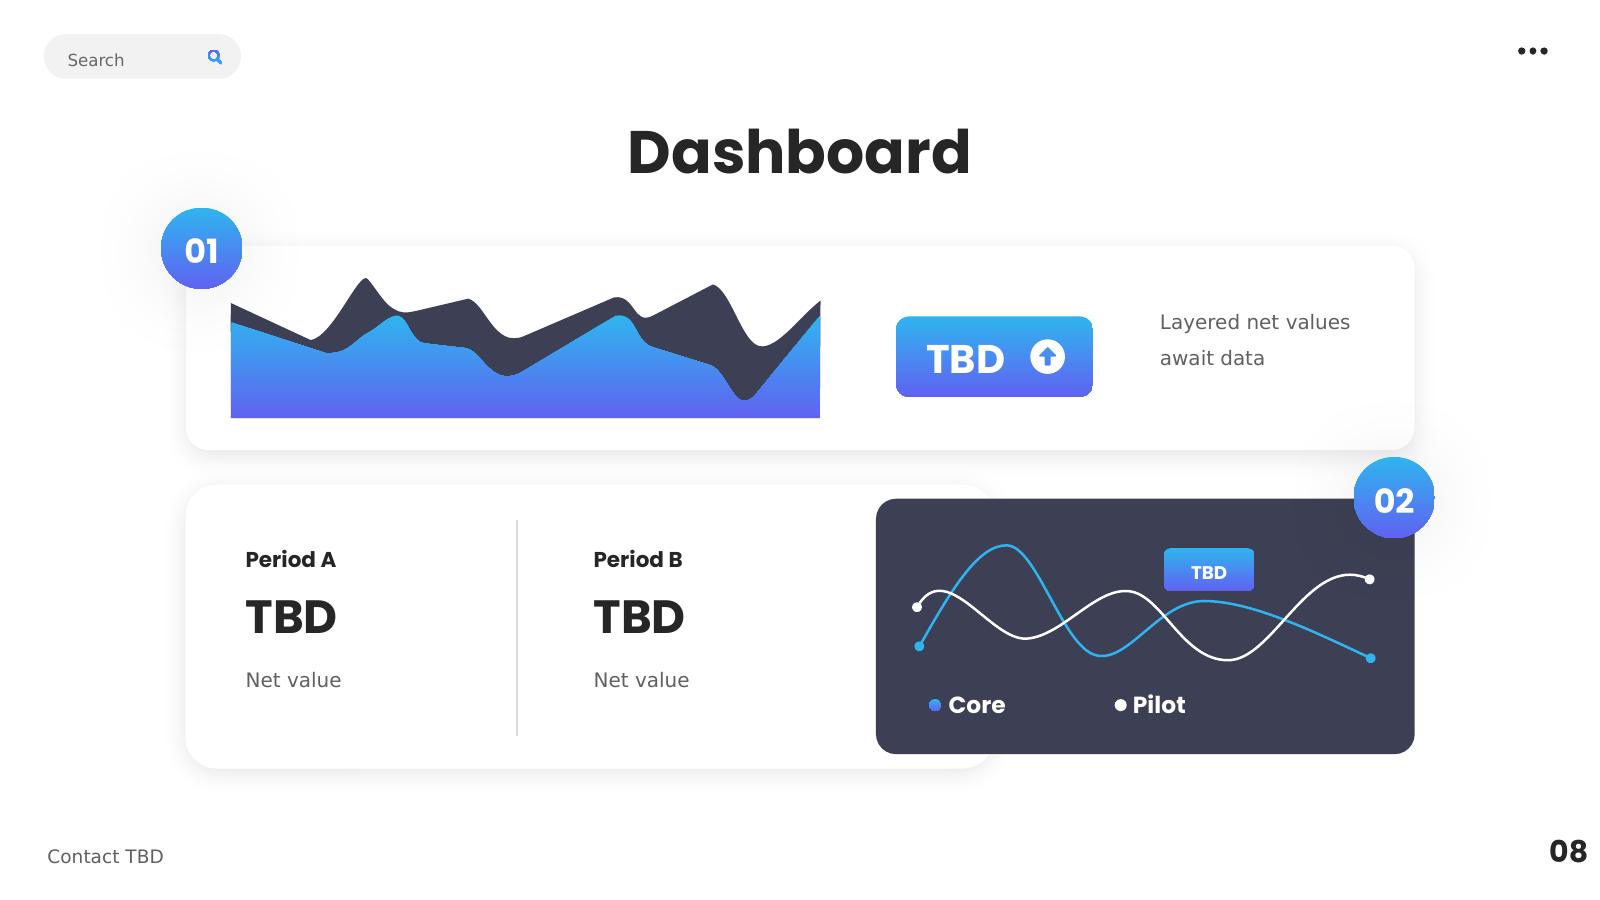
  10. Layered Metrics and Dual Trend Charts
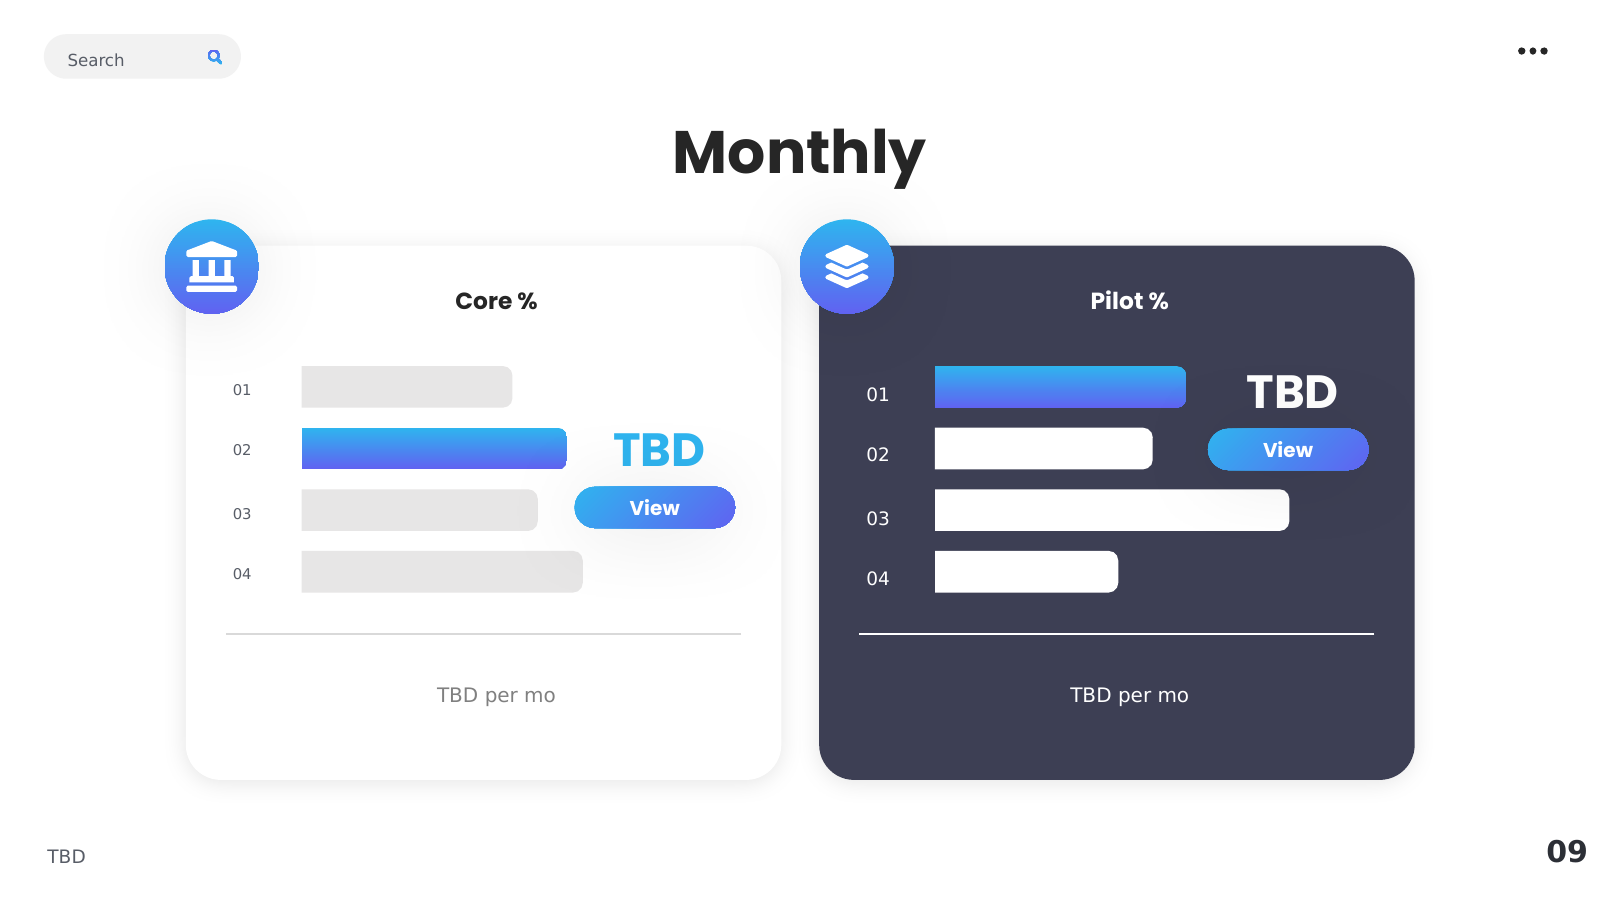
  11. Monthly Performance Comparison Cards
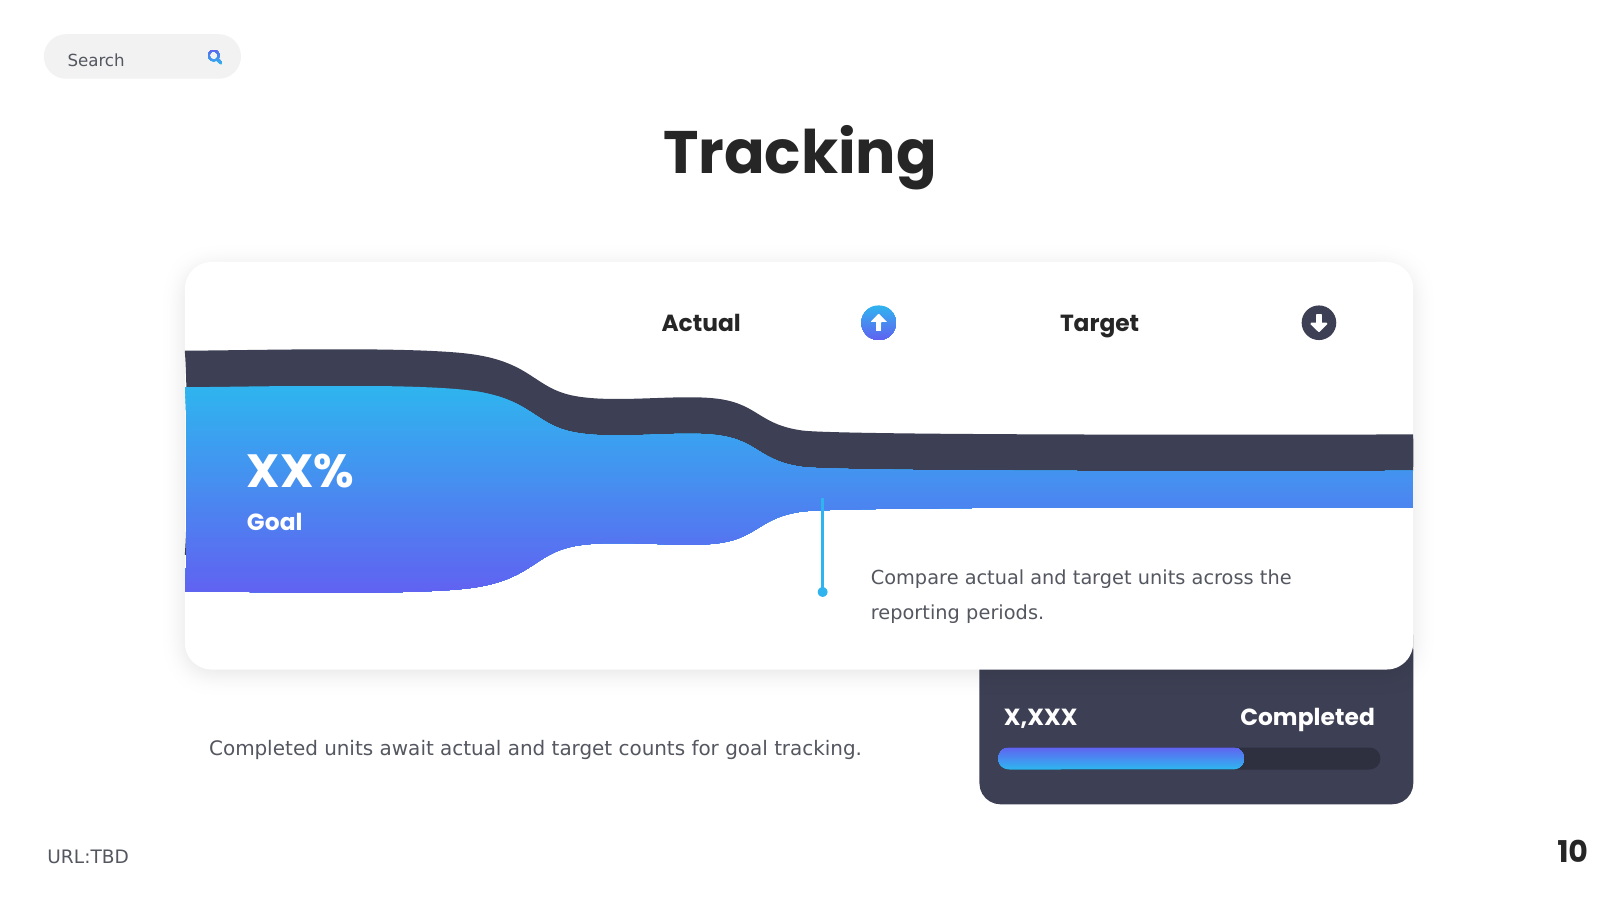
  12. Tracking Progress and Goal Completion