Dark KPI and Analytics Dashboards

Dark executive dashboard templates for reviewing financial, marketing, accounting, and operational results through trends, gauges, funnels, comparisons, and metric cards.

20 slides · Reviews & reports

Every slide in this template

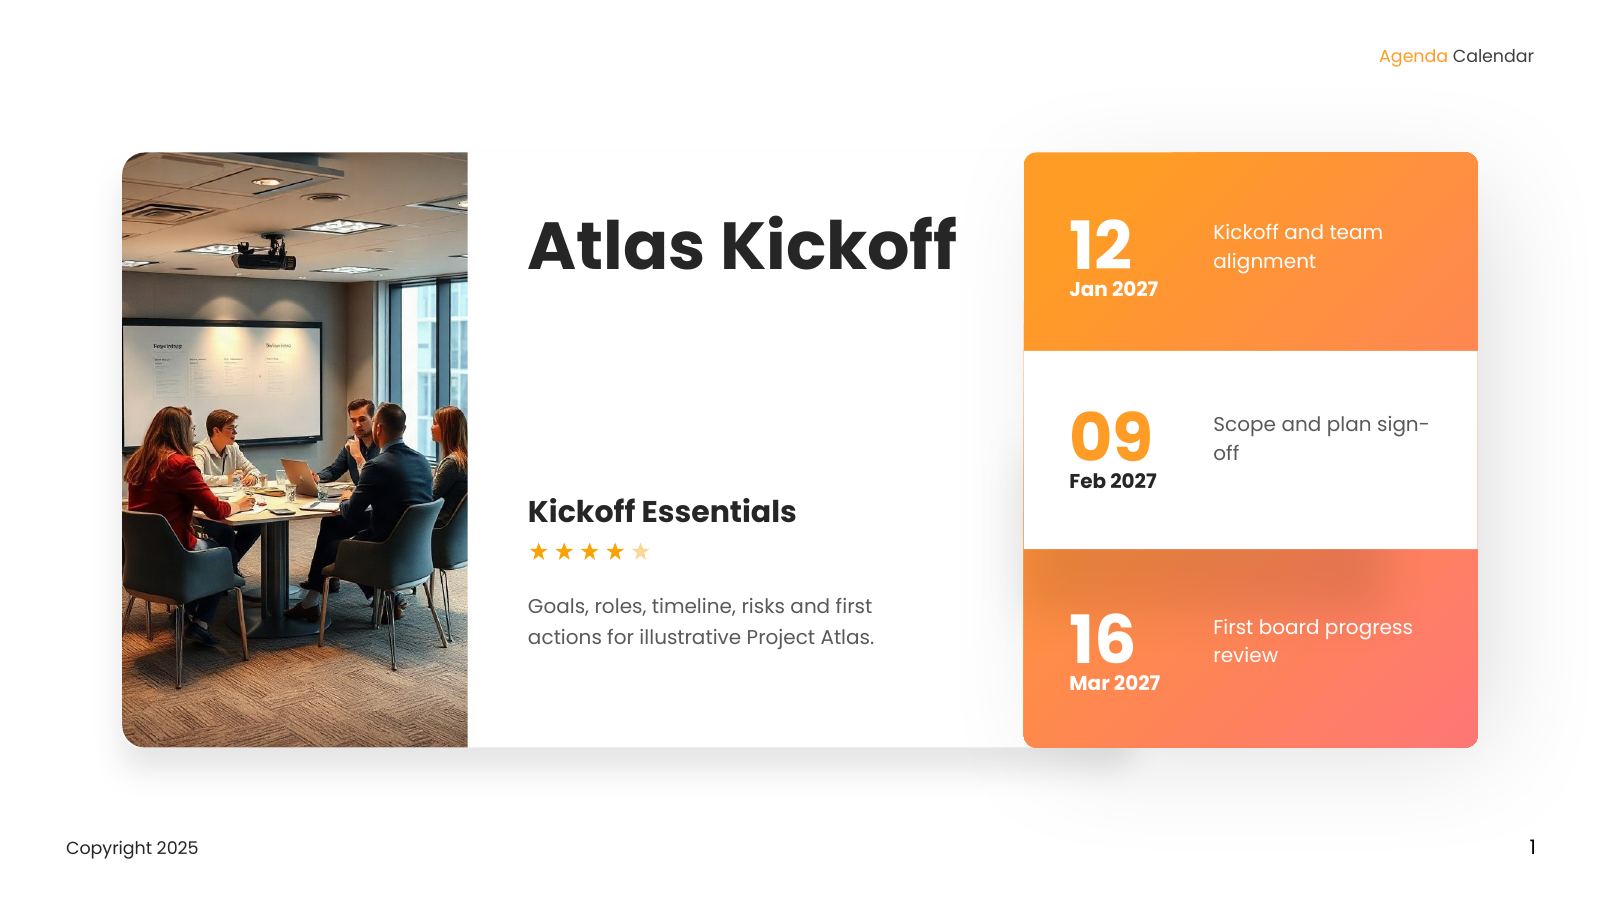
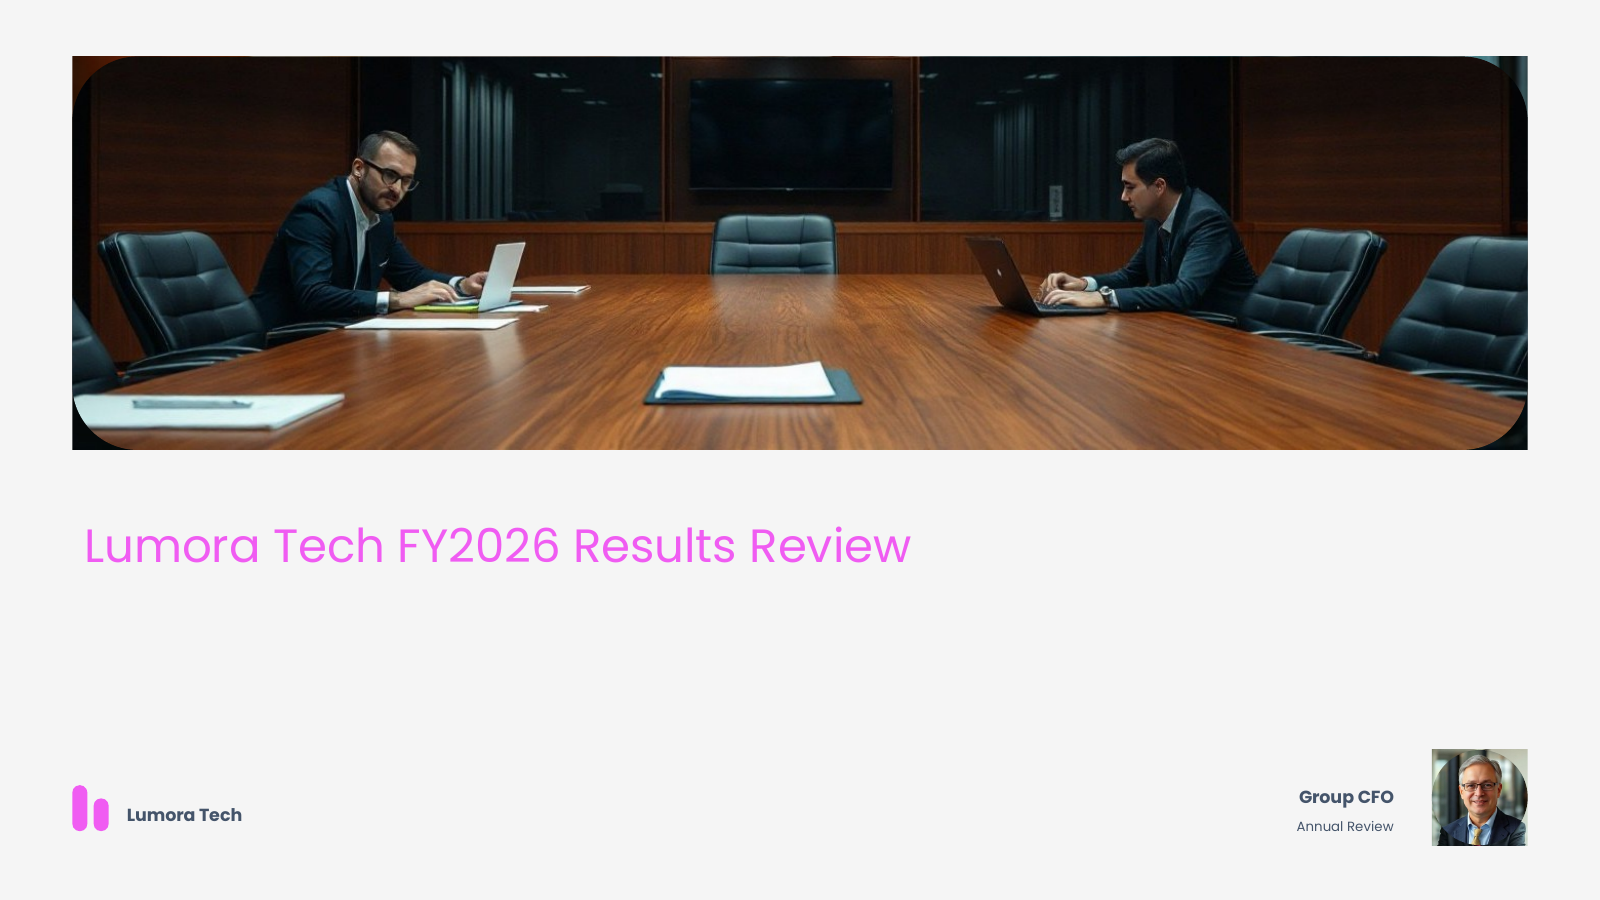
  1. Dark KPI and Analytics Dashboards PowerPoint template with 20 editable dark and blue slides for KPI and analytics reporting by Presentify
  2. Six kpi dashboard slides covering trend and status dashboard, KPI overview, analytics overview and three-part analysis dashboard
  3. Six kpi dashboard slides covering annual range bars and gauges, activity trend and financial KPI and revenue dashboard
  4. Six kpi dashboard slides covering multi-panel analytics summary, income funnel and budget dashboard and annual stacked values dashboard
  5. Trend and Status Dashboard
  6. KPI Overview with Two Metric Cards
  7. Analytics Overview with Activity Cards
  8. Three-Part Analysis Dashboard
  9. Weekly Performance and Context
  10. Management Statistic and Weekly Trend
  11. Annual Range Bars and Gauges
  12. Activity Trend with Headline Outcomes
  13. Financial KPI and Revenue Dashboard
  14. Marketing Gauge and Progress Dashboard
  15. Marketing Performance and Budget Dashboard
  16. Accounting Profit and Rate Dashboard
  17. Multi-Panel Analytics Summary
  18. Income Funnel and Budget Dashboard
  19. Annual Stacked Values Dashboard
  20. Operational Highlights and Records
  21. Two-Indicator Comparison Panel
  22. Indicator Overview with Area Trend
  23. Three-Indicator Performance Panel
  24. Ten Business Success Pillars